As part of the DIAGRAMS 2024 program we offer the following tutorials. The tutorials will take place Friday, September 27. Please click on the links to see the abstract and other information for each tutorial.
- Diagrams in the Age of Kant
- Diagrammatica: A Community-Driven Database for Collecting, Tagging, and Exhibiting Diagrams
- Euclid’s Elements: The Board Game
- Digital Volvelles
- FeynGame — Feynman diagrams made easy
- Forgotten diagrams and their applications in gestures
- Neural Circuit Diagrams: A Diagrammatic Introduction to Deep Learning Models
- Cognitive Modelling of Interpretations of Diagrams and Notations
Diagrams in the Age of Kant
Jens Lemanski (University of Münster)
2024 marks the three-hundredth anniversary of the birth of Immanuel Kant, one of the greatest philosophers of modern times and the most important thinker of the Enlightenment. His contributions to universalist ethics, a philosophy that consistently demands a legal and peaceful world order and an epistemology in which freedom plays an enormous role despite scientific determinism, make him an important anchor point in philosophical debates to this day. What is less well known is that Kant and his followers and successors play an important role in the history of diagrammatic thinking. Kant is the one who popularized diagrammatic representation and reasoning in the 19th century. He has worked with Euclidean diagrams in mathematics as well as with Euler diagrams, partition diagrams, tree diagrams and Byzantine diagrams in logic.
The tutorial ‘Diagrams in the Age of Kant’ reveals Kant’s pioneering work with diagrams in mathematics and logic, which challenged the rationalist and diagram-hostile beliefs of his time. Kant argued for the crucial role of both hand-drawn and mentally imagined diagrams in comprehending Euclidean geometry, and he introduced Euler diagrams in logic education, paving the way for a visual revolution in mathematical teaching that lasted until the late 19th century. The tutorial will introduce the basic diagrams of Kant and the Kantians. Furthermore, it will explore various philosophical topics, such as analytical and synthetic judgments, finite and infinite negation, among others, discussed by Kant and his followers using diagrams.
This will provide participants with the necessary tools to design their own Kantian-inspired curriculum or to incorporate Kantian diagrams and arguments into an existing curriculum. This will address both those scholars who teach entire courses on Kant (philosophers, cultural theorists, historians) and those who wish to incorporate Kant as a historical example into existing curricula (didacticians, mathematicians, logicians). Participants will be guided through a selection of primary and secondary literature, and will have access to teaching materials that can be downloaded from a dedicated website. The session will also highlight existing research gaps and invite participants to contribute to this dynamic field of study. By examining specific examples of logical and mathematical diagrams in Kantianism, participants will gain insight into the diagrammatic foundations of Kant’s ideas and their lasting influence on modern diagrammatic representation and reasoning.
Diagrammatica: A Community-Driven Database for Collecting, Tagging, and Exhibiting Diagrams
J.R. Osborn (Georgetown University)
Diagrammatica offers an online archive for collecting, indexing, tagging, and exhibiting diagrams. Built upon the Omeka S platform, the archive structure is highly flexible and extensible, allowing it to accommodate a range of forms. Rather than defining specific categories of diagram, the archive casts a wide net: soliciting an open call for diagrams and visualizations of any sort and across any medium. This tutorial invites attendees from any discipline or background who are interested in developing the archive as a robust site of collection, exhibition, and collaboration. A prototype of the diagram collection and sample exhibit pages can be viewed at https://diagrams.jrosborn.georgetown.domains
Diagrammatica provides an infrastructural tool for any researcher wishing to house, search, or exhibit a collection of diagrams in a web-accessible platform with richly structured metadata. Use case scenarios include:
- Scholars collecting or examining the diagrams of a specific community, artist, tradition, or theorist.
- Intellectual historians tracing the publication history, citation counts, or applications of a particular diagram.
- Educational and experimental researchers collecting diagrams produced in relation to specific tasks.
- Taxonomists and qualitative researchers asking audiences to classify, sort, or interpret a collection of diagrams.
- Perceptual psychologists or visual theorists analyzing the representational strategies of diagrams.
The Diagrammatica archive is built upon Omeka S, an open-source collections-based web publishing and database platform, and it adheres to the International Image Interoperability Framework (IIIF), an open set of standards for high-quality image sharing that preserves metadata. Both Omeka S and IIIF are supported by robust developer communities, and IIIF compatibility allows the archive to incorporate diagrams that appear in digitized library collections and online archives.
This tutorial introduces participants to the structure of the Diagrammatica database and the Omeka S interface, demonstrating the possibilities that these tools offer to the study and presentation of diagram collections. Participants will learn how to submit diagrams to the archive, how to comment upon and tag the collected diagrams, how to search and browse the database metadata, and how to curate online exhibits that highlight specific diagrams or diagram collections. Attendees will also have the opportunity to suggest refinements to the overall data architecture and suggest new categories and metadata vocabularies. The tutorial aims to create a user community interested in expanding and developing the archive as a collaborative platform of diagram curation, dialogue, and intellectual exchange.
What to bring: Although it is not required, participants are asked to bring a few diagrams that they wish to add to the archive. Knowing the bibliographic data for these diagrams is also useful (e.g. the year of publication, the name of the designer, the source in which the diagram first appeared, and/or the museum that houses the unique diagram). The archive interface is web-accessible, and additions are conducted via web forms. No special technical knowledge is required. However, laptop computers are preferred to smart phones or small tablets.
Euclid’s Elements: The Board Game
Viktor Blasjo (Utrecht University)
I present my boardgame-style edition of Book I of Euclid’s Elements. Participants are provided with a deck of cards with visualisations of Euclid’s propositions and axioms, and a set of fill-in-the-blanks templates for an active and visual reading of Euclid’s proofs, where the reader needs to find the right card to justify each logical step. For some visual impressions, see my Twitter thread:
https://twitter.com/viktorblasjo/status/1563185268013731847
Participants are invited to work interactively and to use these visually and structurally clear presentations of Euclid’s proofs to reflect on the nature of geometry and diagrammatic reasoning. According to participant interests, this may be geared toward experiencing beautiful proofs in a new way, analysing the philosophical foundations of Euclidean diagrammatic practice, relating Euclid’s text to its historical context and cultural impact, or considering mathematical subtleties such as non-Euclidean geometries.
To these ends, I provide a list of reflection and discussion questions, tied to specific propositions and proofs in Euclid’s work. This includes issues such as: Euclid’s use of implicit diagrammatic inferences that are not formally warranted; constructivist diagrammatic control and its relation to counterfactual diagrams for proofs by contradiction; using alternative surfaces such as cones and spheres to bring out implicit assumptions and dependencies; whether “thinking like a Dungeons and Dragons player” captures the heuristic process of how mathematicians come up with proofs; Euclid’s use of superposition and its justification; Euclidean influences in later Western thought and culture.
I have been teaching Euclid this way for a number of years, and I give some tips for those who wish to do the same. I have developed this visual “board game” edition of The Elements to facilitate an active close reading of The Elements and a mathematically substantive and historically faithful engagement with this classic text.
Digital Volvelles
Celeste Pedro and Terhi Marttila (University of Porto)
Volvelles, or wheel charts, are a diagrammatical archetype of information visualisation used to compute combinations of words/concepts, images/other visual signs, or even sounds. Volvelles have a history of more than eight-hundred years and they are often created as interactive devices.
In the first part of this tutorial, we will traverse the history of volvelles as instruments of knowledge production and transmission and their use as tools of creativity. From their arrival in Europe in the 13th century, by the hands of Ramon Llull and his generative rotae (himself influenced by prior Arabic applications of Classical models), to their presence in contemporary art practice, we will review the materiality and practicality of these diagrams with concrete examples. We will also discuss the intellectual processes they try to make visible, such as artificial memory and imagination, while presenting volvelles as logic instruments, calculation and astronomical tools, devotional images, prognostic devices, visualisations of motion, research methods, games, and art.
In the second part of this tutorial, we will explore volvelles using digital and physical prototypes (take a look here: https://thedigitalreview.com/issue03/hacking/begin/index.html#volvelle). Participants will have the opportunity to engage in volvelle-making methods to help question the range and limits of this diagram when applied to different fields of knowledge.
For participants familiar with or interested in engaging in coding their own volvelles, Terhi Martilla forked Logan Franken’s code, so that it can be modified: https://editor.p5js.org/terhi/sketches/Ps48-Vn0k. She “translated” some parts of the code to p5.js to make it more accessible to the creative coding community.
Literature
Crupi, G. (2019). Volvelles of knowledge: Origin and Development of an instrument of scientific imagination (13th-17th centuries). JLIS.It, 10(2), 1-27. https://doi.org/10.4403/jlis.it-12534; Marchese, F.T. (2013). Medieval Information Visualization.
FeynGame — Feynman diagrams made easy
Robert Harlander, Sven Y. Klein and Magnus Schaaf (RWTH Aachen University)
This tutorial introduces FeynGame, a tool for the simple handling of Feynman diagrams.
IMPORTANT NOTICE: In order to actively participate in the tutorial, a laptop with an installation of Java (version 8 or higher) is required. If you need help with the installation of Java, or have questions about the tutorial, please contact robert.harlander@rwth-aachen.de.
Feynman diagrams are a central tool in particle physics. Not only do they allow for an intuitive visualization of quantum effects in the scattering of elementary particles. They also are in one-to-one correspondence to the mathematical expressions of the corresponding scattering amplitudes. This is due to the fact that the associated Feynman rules constitute a complete perturbative representation of the underlying theory.
There is no doubt that today’s particle physics relies crucially on Feynman diagrams. Any particle physicist thus needs to be familiar with them.
It is one of the main purposes of FeynGame to allow for an easy access to Feynman diagrams for the beginner. The predominant mode of operation in this respect is the ”game mode”, where the ”player” is asked to draw valid Feynman diagrams for randomly chosen scattering processes within a certain theory (for example, quantum electrodynamics or the Standard Model of particle physics).
The second mode of operation of FeynGame is the drawing mode, which allows one to draw arbitrary Feynman diagrams very efficiently in high quality. They can then be exported to a number of formats, including JPEG, GIF, PostScript, and PDF. In contrast to other programs with similar purpose, the exported image is optically identical to the image on FeynGame’s “canvas” (WYSIWYG). This even holds for the line and vertex labels, for which FeynGame provides full LaTeX support.
The single most unique property of FeynGame, however, is its model-based character. It knows all the Feynman rules of the underlying theory, which is the basis for the function- ality of the game mode, see above. In this way, each line and vertex can be given specific attributes (line styles, colors, labels, etc.). FeynGame can check for the validity of any Feynman diagram within a particular theory, and it can even produce the corresponding mathematical expression for the amplitude.
Even though FeynGame was designed primarily for particle physics, it may be useful also in other fields. In particular, the program is open source, and any contributions to it will be appreciated. Furthermore, the main developers are open to suggestions for additions and improvements.
The tutorial will guide through the features of FeynGame step-by-step, including options for personalization and the implementation of new models. It is targeted at all audiences, independent of their field and career level.
More information on FeynGame can be found here:
- Note on version 2.1: https://pos.sissa.it/449/657
- FeynGame website: https://web.physik.rwth-aachen.de/user/harlander/software/ feyngame
- YouTube channel: https://www.youtube.com/@FeynGame-tp3if
Forgotten diagrams and their applications in gestures
Reetu Bhattacharjee (University of Münster, Germany)
The goal of this tutorial is to demonstrate how multimodal communication, involving both visual and tactile elements, can be utilized to check the validity of various syllogistic moods.
In the visual communication segment, I will introduce ‘Byzantine diagrams’ in a new light. These kinds of diagrams were introduced by Byzantine scholars for studying and teaching Aristotelian logic. These diagrams include three different shapes, viz. crescent, triangle, and inverted triangle, and each of these shapes has been used to represent three figures, namely, the first, the second, and third figures, of the Aristotelian syllogism. The vertices of these shapes denote the major, minor, and middle terms of a syllogism. The edges represent the relations between these three terms.

Fig 1: Byzantine diagrams representing three figures of Aristotelian syllogism. 1, 2, and 3 represent the first premise, second premise, and conclusion respectively. Three vertices show the three terms. The edges represent the relations between the terms where the arrow tail represents the position of the subject and the arrowhead represents the position of the predicate.
Although Byzantine diagrams were extensively used from the Middle Ages to the 18th century, they were mostly popular during the 16th century. However, after the 16th century, these diagrams were losing their popularity. From the 19th century onward, their application method was completely forgotten and these diagrams were tagged as ‘unsuitable’ for diagrammatic reasoning and were considered mere memory aids. However, this view will be challenged in this presentation and a novel approach to employ these kinds of diagrams to check the validity of syllogism through reduction method proof, both direct and indirect will be introduced.
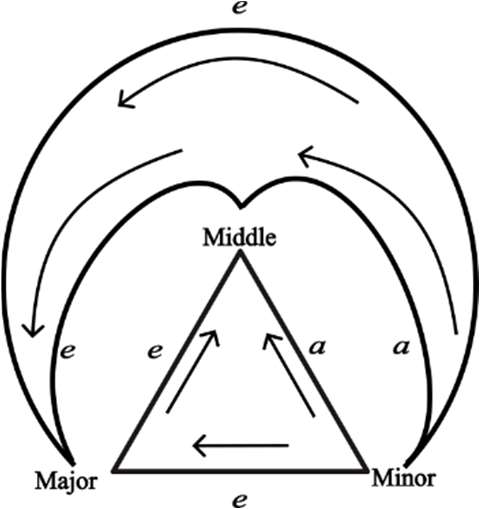
Fig 2: Byzantine diagram showing the validity of the second figure syllogism ‘Cesare’ by reducing it to the first figure syllogism ‘Celarent’.
For the next segment of the tutorial, I will explore the transferability of visual information to tactile sensations. In the 16th century, when Byzantine diagrams were at the peak of their popularity, Leuven scholar Cornelius Valerius, proposed a hand gesture where we only use three fingers, viz. middle, index, and thumb, to represent the triangular shape of the Byzantine diagrams. He proposed, that the thumb, index, and middle fingers represent middle, major, and minor terms respectively. However, he did not further elaborate on his method. During this small presentation, I will show that this hand gesture works exactly like the byzantine diagrams and is thus capable of showing the validity of syllogisms.
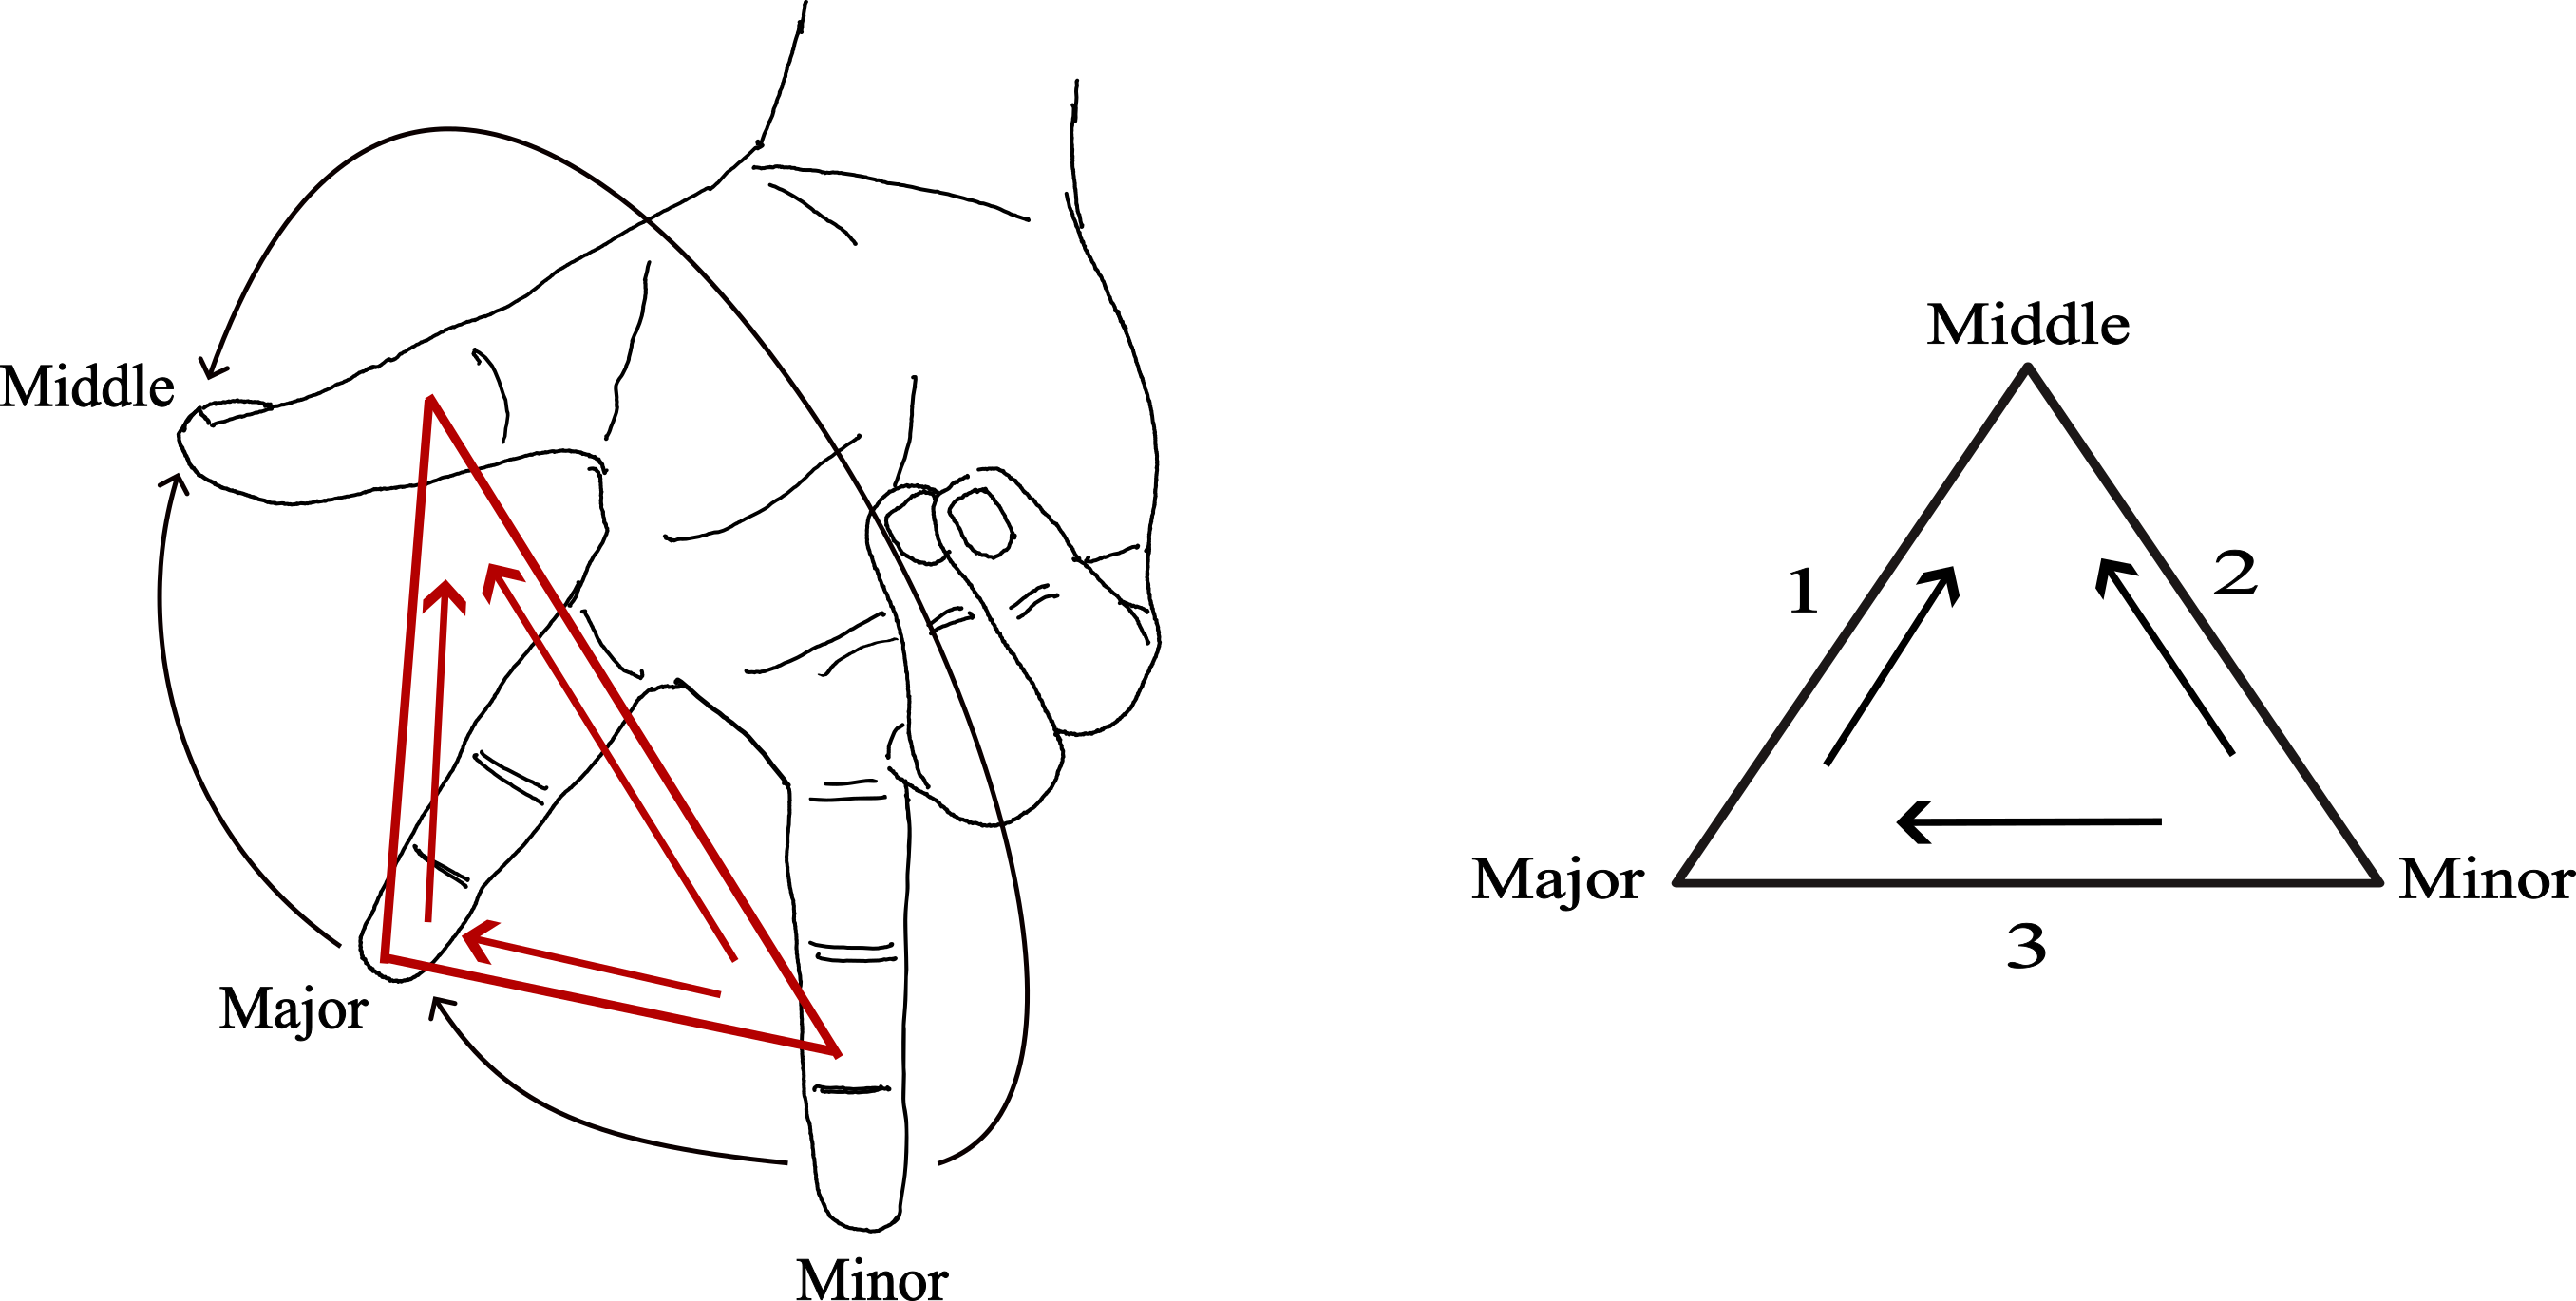
Fig 3: Hand gesture (on the left) representing the second figure of the syllogism (on the right).
The byzantine diagrams themselves alone are not multimodal. However, as the gesture works exactly like the byzantine diagrams, we can create a transferability of information from the diagram to gesture and vice-versa. Thus, we are creating a multimodal communication chain through hand gestures as it combines both visual with tactile elements.
The tutorial will be divided into four main sections:
- Preliminary introduction to syllogisms and validity check.
- Usage of Byzantine diagrams in the direct and indirect reduction method for validity checking.
- Transferability of information from diagrams to gestures and vice-versa will be shown by performing hand gestures while showing the transformation of the diagrams for the same reduction process.
- Engaging the audience to perform the reduction process, by themselves, for both diagrams and gestures.
Neural Circuit Diagrams: A Diagrammatic Introduction to Deep Learning Models
Vincent Abbott (Australian National University)
Deep learning is at the forefront of human technology. Neural circuit diagrams are a novel method for clearly communicating all the details of deep learning architectures, allowing for straightforward comprehension, analysis, and implementation. They are based on category theory but innovate on traditional methods in order to express both the details of axes and the assembly of independent data. Neural circuit diagrams use a combination of wires, dashed lines, and pictograms to represent models in a rigorous manner. Their flexibility allows for extensive annotation and distinctive art styles to be applied.
This interactive tutorial will explain the basics of neural circuit diagrams and have participants implement a basic neural network for recognising digits and an attention mechanism for natural language processing in Python/PyTorch. No prior machine learning or coding experience is required; this tutorial will introduce all the essential concepts using diagrams. It is aimed at researchers curious about machine learning and formal yet flexible diagrammatic methods for complex systems.
Cognitive Modelling of Interpretations of Diagrams and Notations
Peter Cheng (University of Sussex), Grecia Garcia Garcia (University of Sussex), Fiorenzo Colarusso (University of Sussex), Mateja Jamnik (University of Cambridge) and Daniel Raggi (University of Cambridge)
This tutorial introduces a novel approach to modelling how users comprehend diagrams and other representational systems. Being able to characterize users’ interpretations of the information available in representational systems is valuable for many reasons. Researchers interested in the nature and the use of diagrams can analyze how the information contained in an external representation produces the internal mental representation that drives thinking and underpins learning. On an applied dimension, the form of representations substantially impacts how easily users are be able to decode and exploit task domain content. Thus, designers of diagrams, coders of user interfaces and producers of educational materials may benefit from being able to quickly, and soundly, predict the relative efficacy of alternative representations systems.
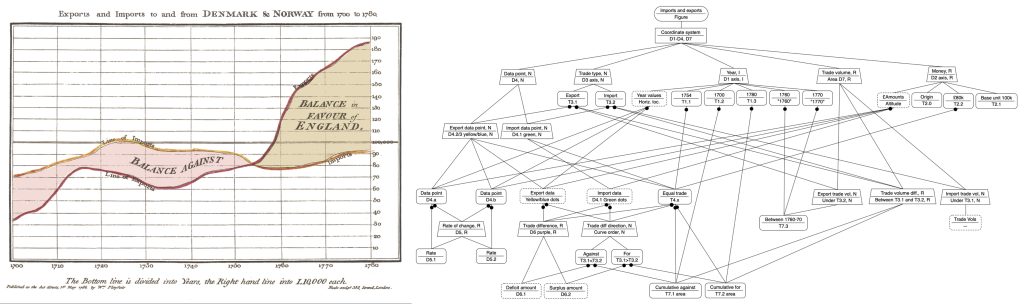
The models are built by assembling a network of graphical objects that represents the structure of the information that users build in their minds as they interrogate a representation. The figure on the right is an example of a model of an expert’s interpretation of Playfair’s famous early line graph, on the left.
For members of the diagrams community the approach makes feasible the theoretical investigation of a range of questions, such as: How does the efficacy of alternative diagrams for the same domain vary for a typical user? How do users with varying levels of familiarity of a class of diagrams understand the contents of those diagrams? How does the information users extract from a diagram depend on the goals of the users? How might interpretations change moment to moment as a user initially decodes a representation? What changes as a user learns to use a class of diagrams over days or weeks as their competence grows?
The main focus of the tutorial will be graded activities in which participants will build of models of representational systems and consider their implications. The tutorial will include a brief summary of the theory that underpins the approach – Representational Interpretive Structure Theory (RIST). RIST is operationalized in the graphical modelling notation (RIS-Notation, RISN). We provide an easy to master web-based tool for building the models (RIS-Editor, RISE).
No prior experience of cognitive modelling is required. To fully benefit from the tutorial participants should bring their own laptop computer running any common web browser. The editors and existing training materials for the approach can be found here: http://users.sussex.ac.uk/~peterch/RIST/.